
In short
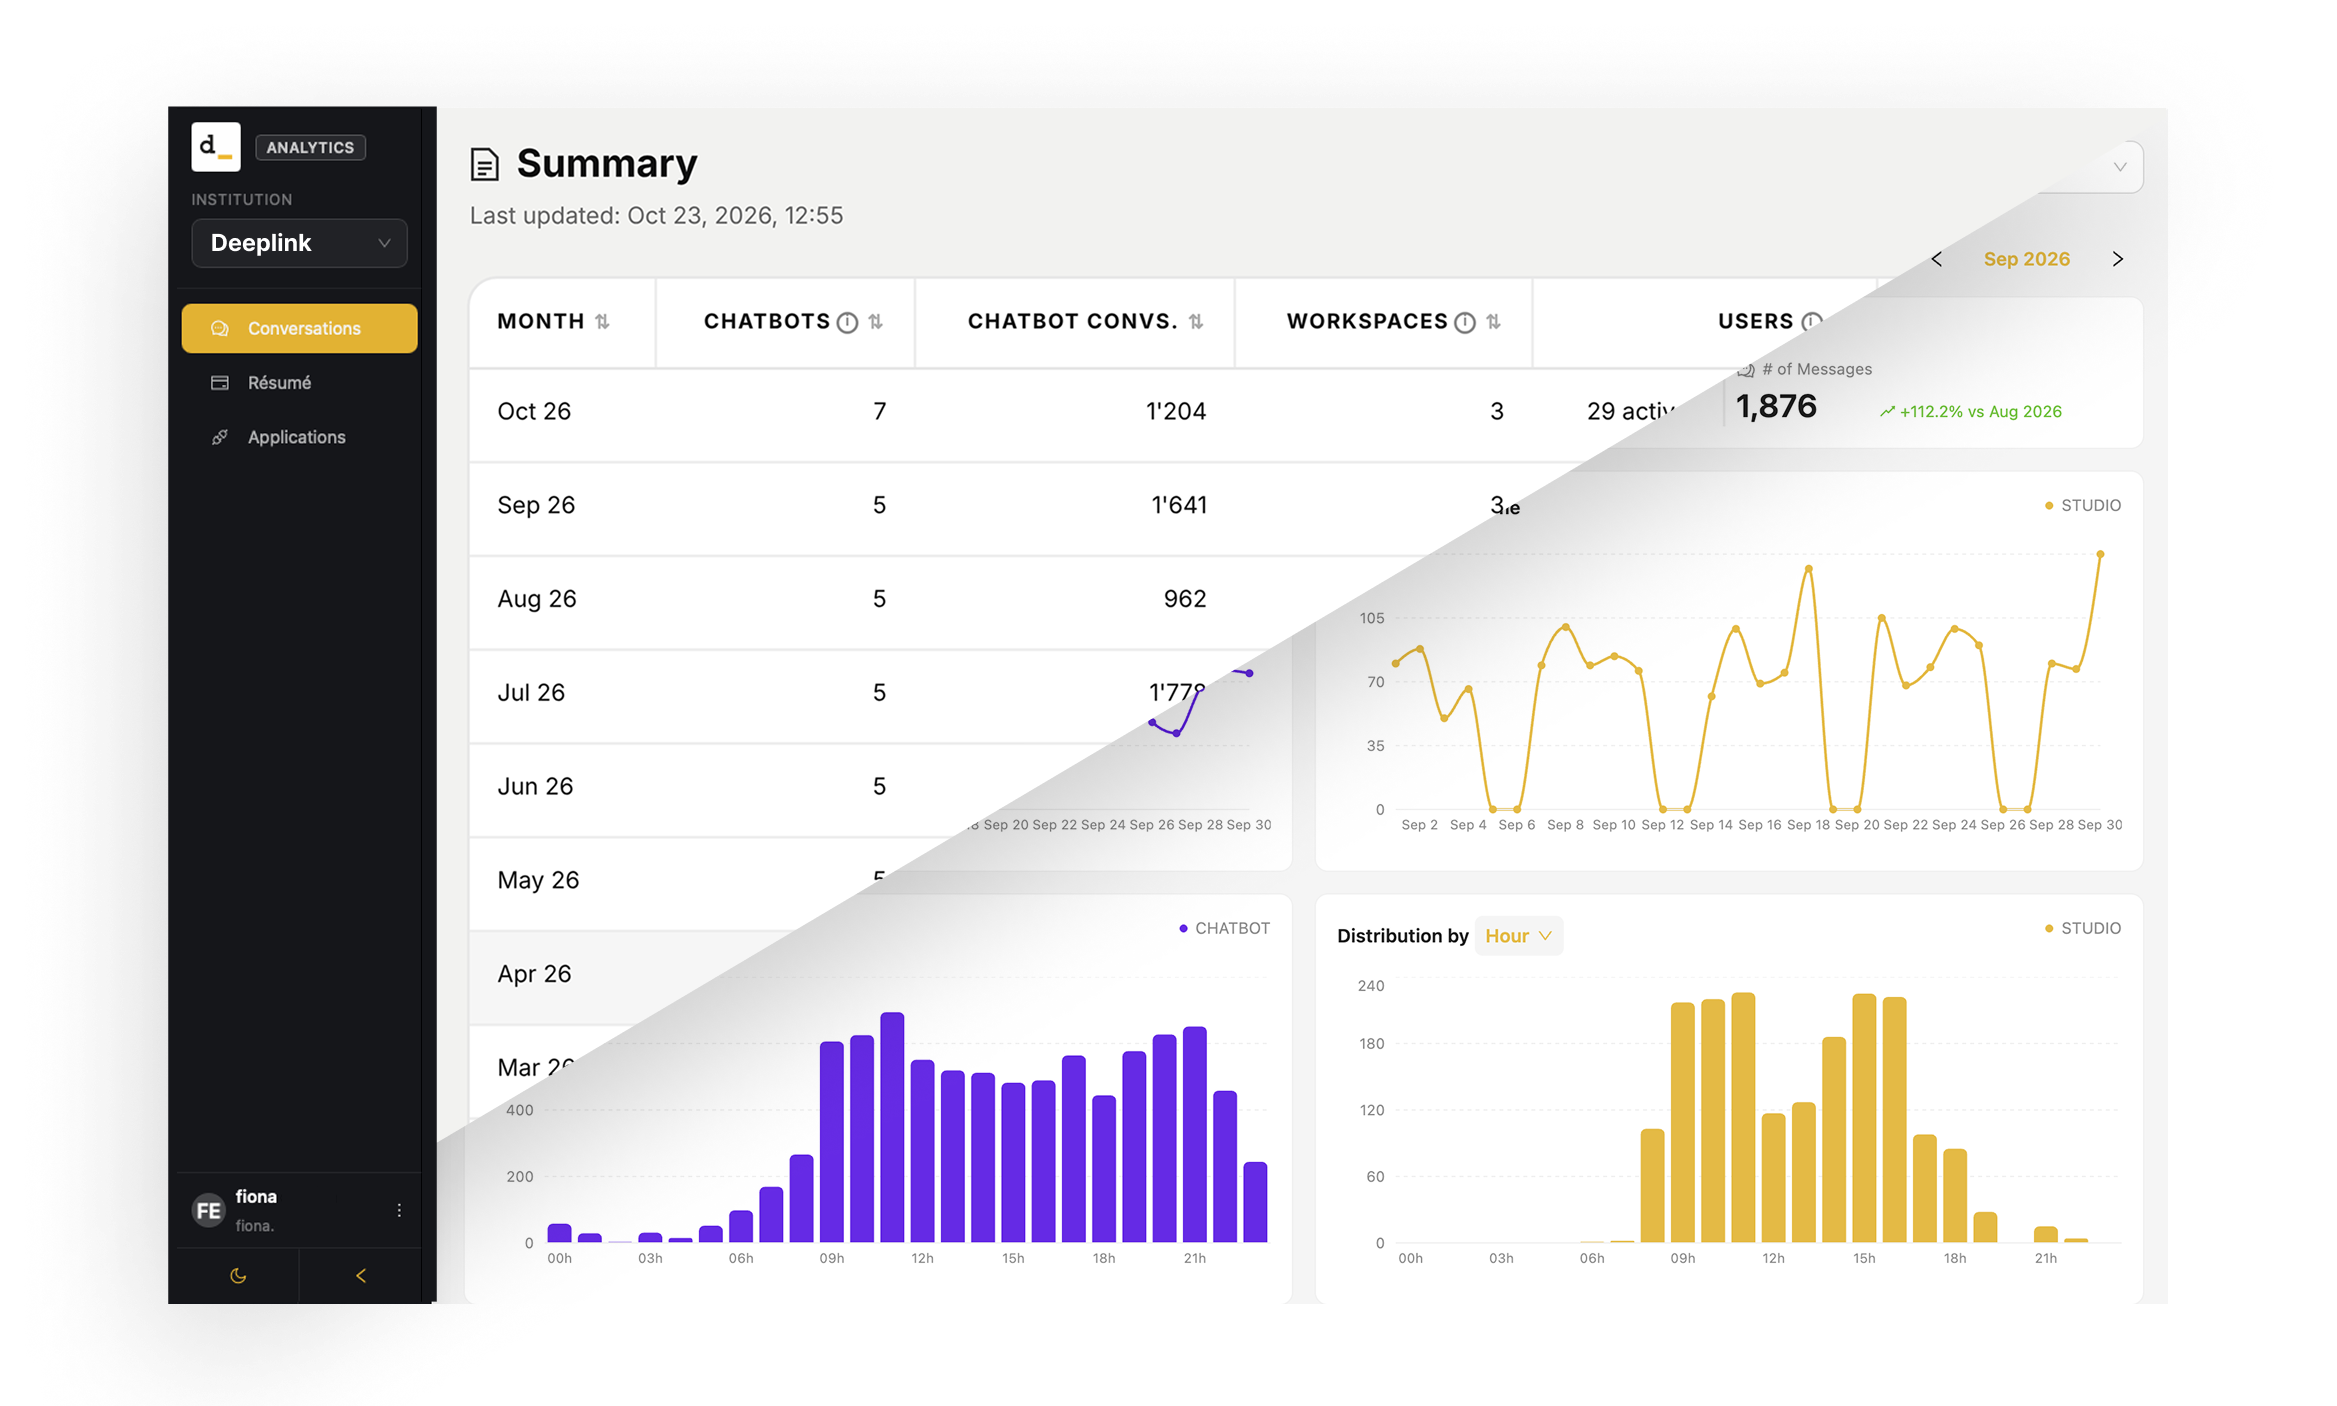
Administrators have access to an app, Analytics, that allows them to view how their organization uses Deeplink: chatbots, Studio, audio transcription, agents, and users. The app has two pages:
- Summary: a monthly overview of all usage metrics on a single screen
- Conversations: a detailed analysis of usage across the Chatbot and Studio channels, side by side, for the time period of your choice
Benefits
- Adoption visibility: See at a glance how many registered users are actually using the platform.
- Track progress over time: The monthly history highlights trends (growth, seasonality, the impact of training sessions or new launches).
- Compare channels: Chatbot and Studio, using the same metrics, all on a single screen.
- Understand your users: at what time and on what day they ask their questions, in which language, and from which region.
- Identify what’s working: which chatbots and business spaces are used most, and which aren’t.
- Compare workspaces: the filter lets you analyze each team or department separately.
- Measure the value delivered: conversations, transcribed audio hours, and agent sessions provide concrete metrics for internal reporting and to justify the investment.
- All in one place: no need to request these metrics from Deeplink support anymore.
- Translated with DeepL.com (free version)
Who is it for
| Profile | Access | What they see |
|---|---|---|
| Institution admin | Yes | All workspaces in their institution |
| Workspace admin | Yes | Only the workspaces they have access to |
| User | No (not yet) | — |
NB : all figures always depend on the workspaces selected in the filter. The filter only lists the workspaces the user has permission to see.
Summary Page
What is presents
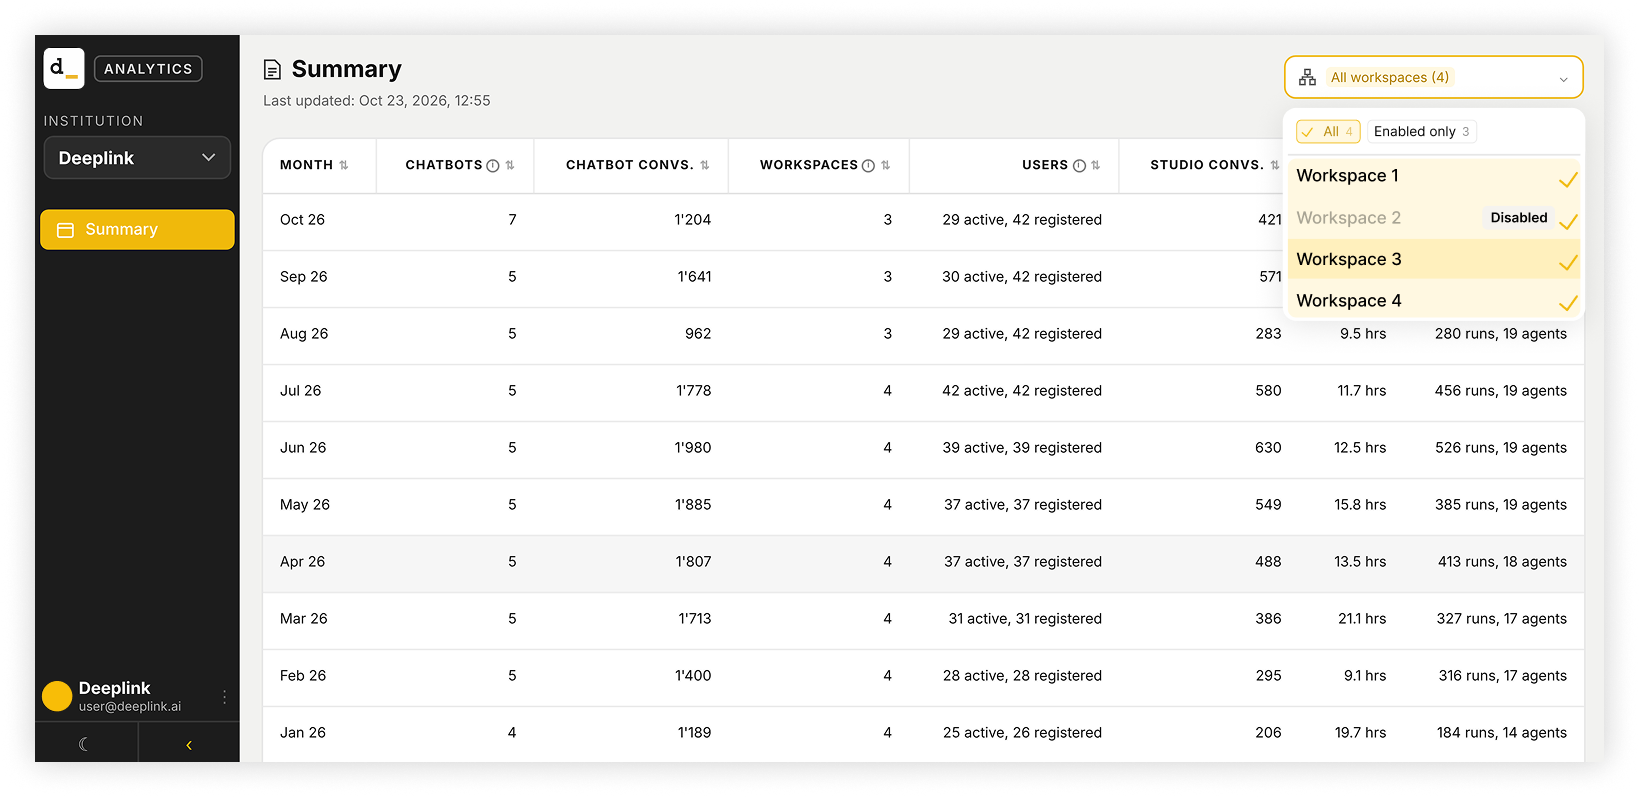
A table with one row per month and the indicators below. Every column can be sorted, and some have a “ⓘ” icon with an explanation.
| Column | Meaning | Exemple |
|---|---|---|
| Month | Reference month | Oct 26 |
| Chatbots | Number of chatbots the organisation has | 7 |
| Chatbot convs. | Number of conversations held through the chatbots | 1’208 |
| Workspaces | Maximum number of workspaces active at the same time during the month | 4 |
| Users | Active users compared with the total number of registered users | 29 active, 42 registered |
| Studio convs. | Number of conversations held in the Studio | 421 |
| Audio | Volume of audio transcribed (hours/minutes/seconds) | 4.3 hrs |
| Agents | Number of agent runs and number of existing agents | 315 runs, 20 agents |
Conversations Page
What it presents
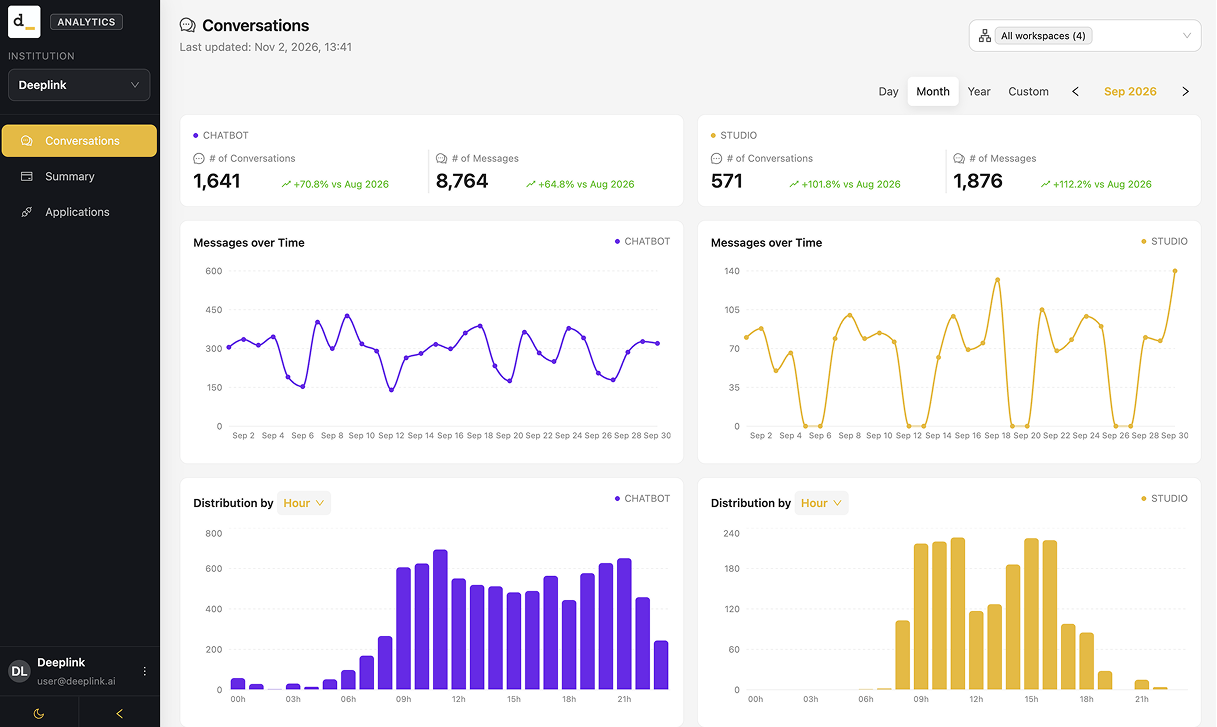
The page is divided into two columns: Chatbot on the left (purple) and Studio on the right (yellow). Each block displays the name of its channel in the upper-right corner.
| Block | What it shows |
|---|---|
| Key indicators | of Conversations and # of Messages, with the change versus the previous period (e.g. “+70.8% vs Aug 2026”) |
| Messages over Time | Number of messages across the selected period |
| Distribution by Hour / Day of week | When messages are sent: by hour of the day or by day of the week (selector in the title) |
| Messages by Language | Donut chart with the total number of messages and the share per language |
| Messages by Region | Bar chart of messages per country/region |
| Usage by Chatbot (Chatbot) | Table per chatbot: conversations and messages, with a total row |
| Usage by Workspace (Studio) | Table per workspace: users, conversations and messages, with a total row. Inactive workspaces are labelled Inactive |
Page-Specific Command
- Period: Day, Month, Year, or Custom (date range), with arrows to navigate to the previous or next period.
- Focus mode: Click on a language, chatbot, or business area to filter the entire page to display only data for that selection. An indicator appears in the top-left corner. To exit this mode, click the same item again, press Esc, or click the “×” on the indicator.
- Tables: Search, sort columns, and pagination.
Elements common to both pages
- “Last Updated”: Date and time of the last data update.
- Select Institution: Upper-left corner.
- Filter by Business Area: Upper-right corner.
- “All”: All business areas, including those that are disabled.
- “Active Only”: active business spaces only.
- You can also select one or more specific business spaces. Disabled business spaces are marked with “Disabled.”
- Navigate between the “Summary” and “Conversations” pages: sidebar.
- Dark mode and collapsible sidebar: lower-left corner.