
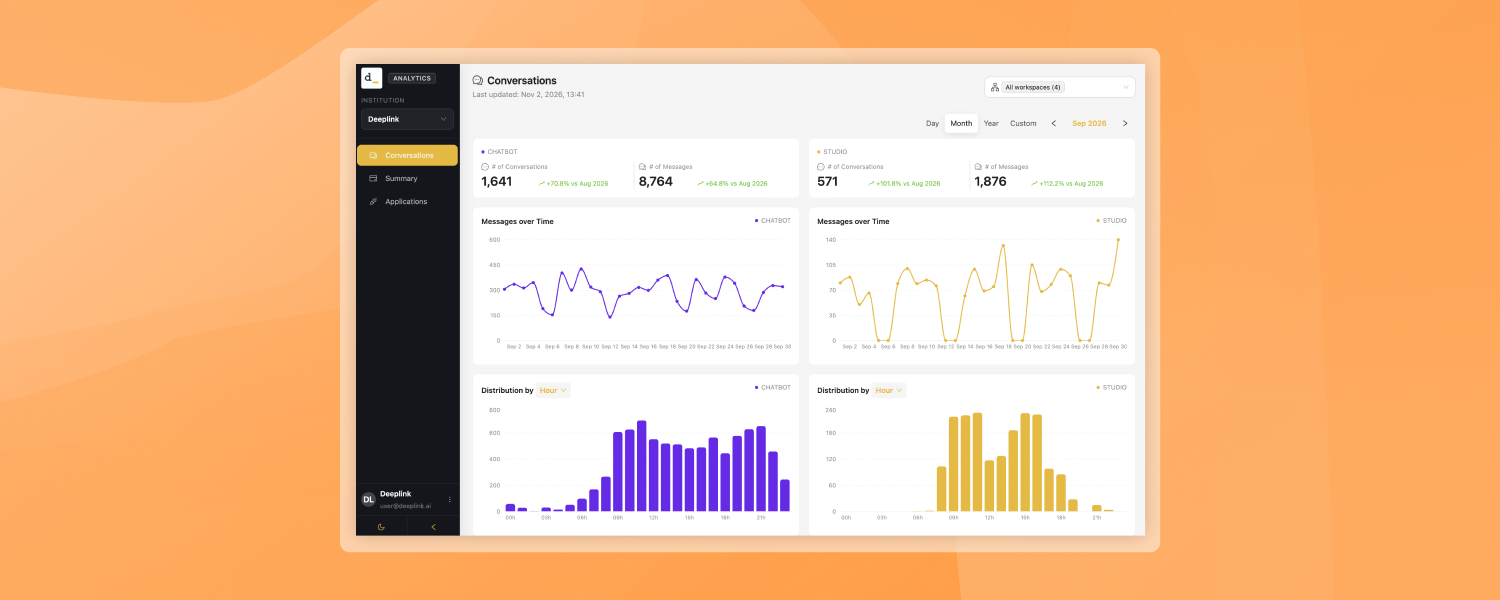
The Analytics app has a new Conversations page that shows, on a single screen and side by side, how the Chatbot and Studio channels are used over the period you choose.
Benefits
- Compare channels briefly: Chatbot and Studio side by side, with the same indicators.
- Spot trends quickly: the change versus the previous period shows immediately whether usage is growing.
- Understand your users: when they ask questions (hour, day of the week), in which language and from where.
- Identify what works: which chatbots and workspaces are used most, and which are not used at all.
- Drill down in one click: focus mode turns the whole page into a view of a single chatbot, workspace or language.
What the page contains
The page is split into two columns: Chatbot on the left (purple) and Studio on the right (yellow). Each block shows its channel label in the top-right corner.
| Block | What it shows |
|---|---|
| Key indicators | of Conversations and # of Messages, with the change versus the previous period (e.g. “+70.8% vs Aug 2026”) |
| Messages over Time | Number of messages across the selected period |
| Distribution by Hour / Day of week | When messages are sent: by hour of the day or by day of the week (selector in the title) |
| Messages by Language | Donut chart with the total number of messages and the share per language |
| Messages by Region | Bar chart of messages per country/region |
| Usage by Chatbot (Chatbot) | Table per chatbot: conversations and messages, with a total row |
| Usage by Workspace (Studio) | Table per workspace: users, conversations and messages, with a total row. Inactive workspaces are labelled Inactive |
Controls
- Period: Day, Month, Year or Custom (date range), with arrows to move to the previous/next period.
- Workspace filter: same as on the Summary page (top-right corner).
- Focus mode: click a language, a chatbot or a workspace and the whole page shows only that data. A focus indicator appears at the top left of the page. To exit, click the same item again, press Esc, or click the × on the focus indicator.
- Tables: search, column sorting and pagination.